Agricultural Systems Topic Advisory Group
The Agricultural Systems TAG has two main areas of work:
Firstly, it provides practical understanding to ground the project in the real world of agriculture and provide holistic overview of matters.
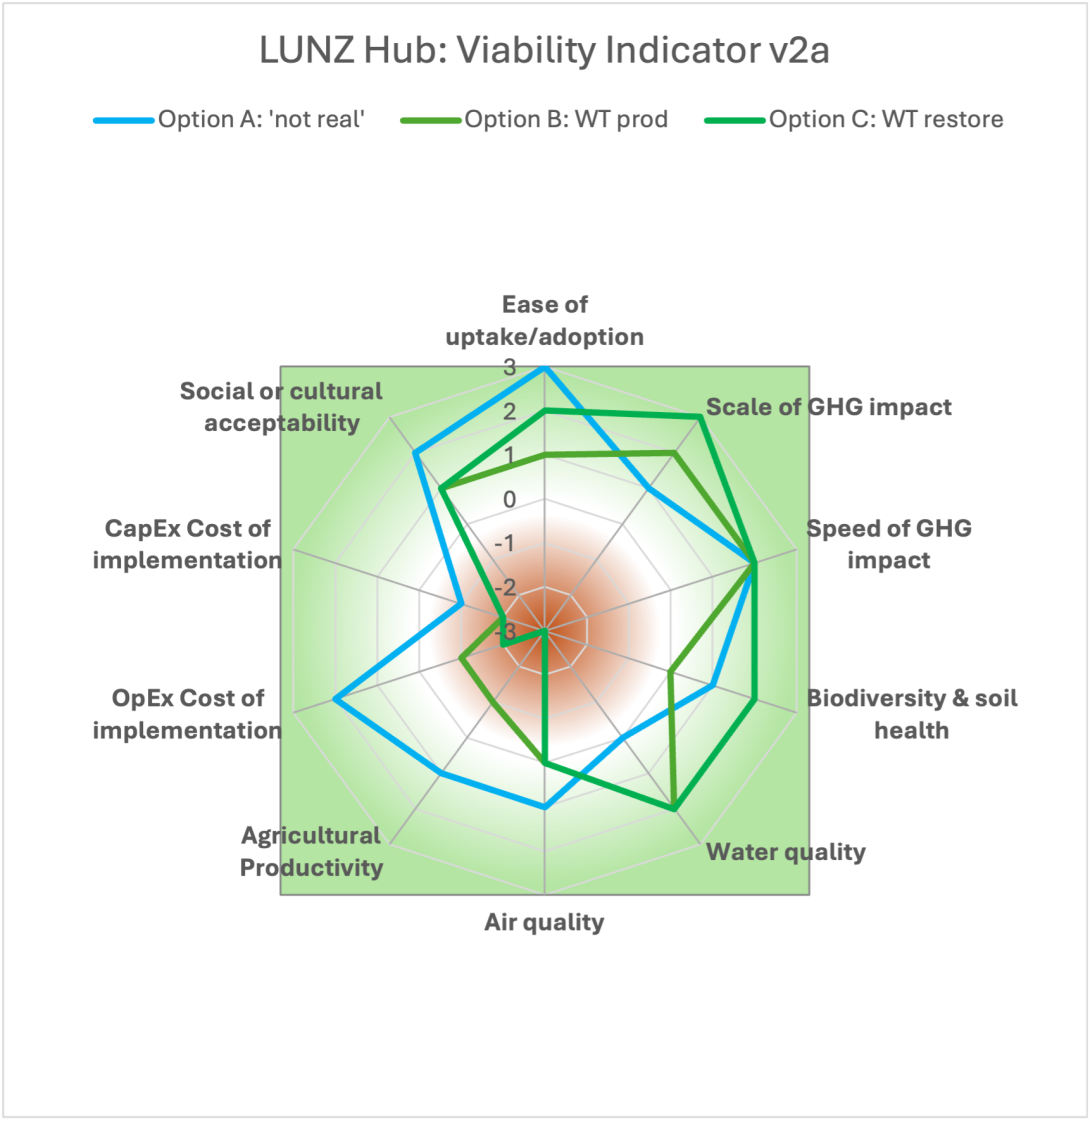
Secondly, there is a specific activity to develop a Viability Indicator, which will enable policy makers and land managers to compare management options for progressing towards net zero. The progress so far, and current thinking is outlined below.
What are Agricultural Systems considering?
The group has a wide range of practical considerations. Below are some of the factors being addressed and considered:
- What changes will enable different production systems to reduce emissions, as well as unintended consequences (such as on biodiversity and important ecosystem services)?
- Which emerging technologies for GHG removals represent pragmatic and viable solutions for different farming systems?
- What technologies and solutions for net zero work at different scales (and highlight cost-benefits and trade-offs)?
- What improved metrics are required for monitoring farming systems to identify pinch-points in business-as-usual for net zero, prioritisation of viable interventions and for identifying any unintended consequences of adaptation and transformation at farm, regional and national scales?
Viability indicator
After testing within the consortium and with a wider audience we have refined the indicator to assess the implications listed below. This has also been informed by some piloting of the assessment approach. Our approach aims to score the expected impacts of interventions and technologies at different scales (farm, regional, national) for different commodity types and mixes. This will include efficacy for multiple outcomes and co-benefits and highlight any constraints or conflicts with other priorities (i.e., trade-offs).
| Implication of measure | Scoring for measure |
|---|---|
| Ease of uptake/adoption | Very difficult= -3, very easy = +3 |
| Scale of GHG impact | Large increase= -3, large decrease = +3 |
| Speed of GHG impact | Very slow= +1, very quick = +3 |
| Effect on biodiversity & soil health | Large decrease= -3, large increase = +3 |
| Effect on water quality | Large decrease= -3, large increase = +3 |
| Effect on air quality | Large decrease= -3, large increase = +3 |
| Effect on Agricultural productivity | Big reduction = -3, Good increase = +3 |
| OpEx Cost of implementation | High income foregone= -3, Large benefit from adoption = +3 |
| CapEx Cost of implementation | High cost= -3, positive impact = +3 |
| Social or cultural acceptability | Totally unacceptable = -3; complete support =+3 |
| Confidence in measure (Do as colour code Green or Blue) | Green= well evidenced with consistent outcomes, Blue = Limited evidence and/or conflicting information, expert opinion considers 'should' be a benefit |
To help illustrate this, below is an example of how the indicator might look:

Our current work is focussing on compiling a list (co-ordinated with other groups of the Hub) to specify the specific actions associated with interventions and then assess them. We will be using a team of experts to do this, prior to testing and validating our assessments with a wider group including stakeholders. The output will be a practical and accepted shared set of levers for land management practices, which consider business implications against practicality and ease of uptake.

Professor Adrian Collins
Agricultural Systems

James Clarke
Agricultural Systems


